
Apr 7, 2026
Google Maps Plotting Multiple Addresses: 4 Pro Methods
Learn how to master Google Maps plotting multiple addresses. A guide to My Maps, Sheets, APIs, and a custom Bubble.io build for founders and no-coders.

You have a spreadsheet open with a list of addresses. Maybe they are customers, properties, leads, technicians, franchise sites, or delivery drops. The first question is simple. How do I get these onto a map without spending half a day dropping pins one by one?
That is where most founders hit the same fork in the road. The quick answer is easy. The right answer depends on whether you need a one-off map, a workflow that updates every week, or a real product feature inside your app.
For google maps plotting multiple addresses, there is a ladder of options. Start with the lightest tool that solves today’s problem. Move to API and Bubble only when your product needs live data, filters, user-specific views, or automation.
Your Addresses Are in a Spreadsheet Now What
A spreadsheet full of addresses usually starts as an ops task and turns into a product decision fast. One founder wants a territory map for a sales meeting. Another needs to show nearby providers inside a Bubble app. Same raw input. Very different build paths.

The first problem is simple. Google Maps handles one address well, but a list of 100, 500, or 5,000 addresses needs structure. You need clean fields, a way to geocode consistently, and a method that matches what the map is supposed to do for the business.
I see founders make the same mistake in client builds. They jump straight to the Google Maps API because it feels like the serious option. Sometimes that is right. Often it is extra cost and setup before anyone has proven the map needs live filters, user-specific results, route logic, or app-level automation.
Four methods that fit different stages
Use the lightest method that solves the actual job:
Need a visual map for planning or reporting: Use Google My Maps.
Need something your team can refresh from a spreadsheet: Use Google Sheets with geocoding support.
Need custom behavior, dynamic data, or scale: Use the Google Maps API.
Need the map inside your product: Connect Bubble to your address data and map element.
The trade-off is control versus speed. My Maps gets you from spreadsheet to pins quickly, but it is not a product feature. Sheets-based workflows help with repeatability, but they still sit outside your app. API builds give you control over marker logic, search radius, clustering, and permissions, but they also bring quota management, error handling, and more moving parts.
For an MVP on Bubble, the best choice usually depends on one question. Is the map just helping your team see locations, or is it part of what users are paying for?
Start with the user job. If the map supports an internal workflow, keep setup light. If the map drives matching, discovery, dispatch, or bookings inside your app, design for live data and control from the start.
The Quick and Simple Plot with Google My Maps
A founder usually reaches for My Maps after the first spreadsheet is finally clean enough to trust. They want to see coverage, spot gaps, and show the team something visual today, not after an API setup project.
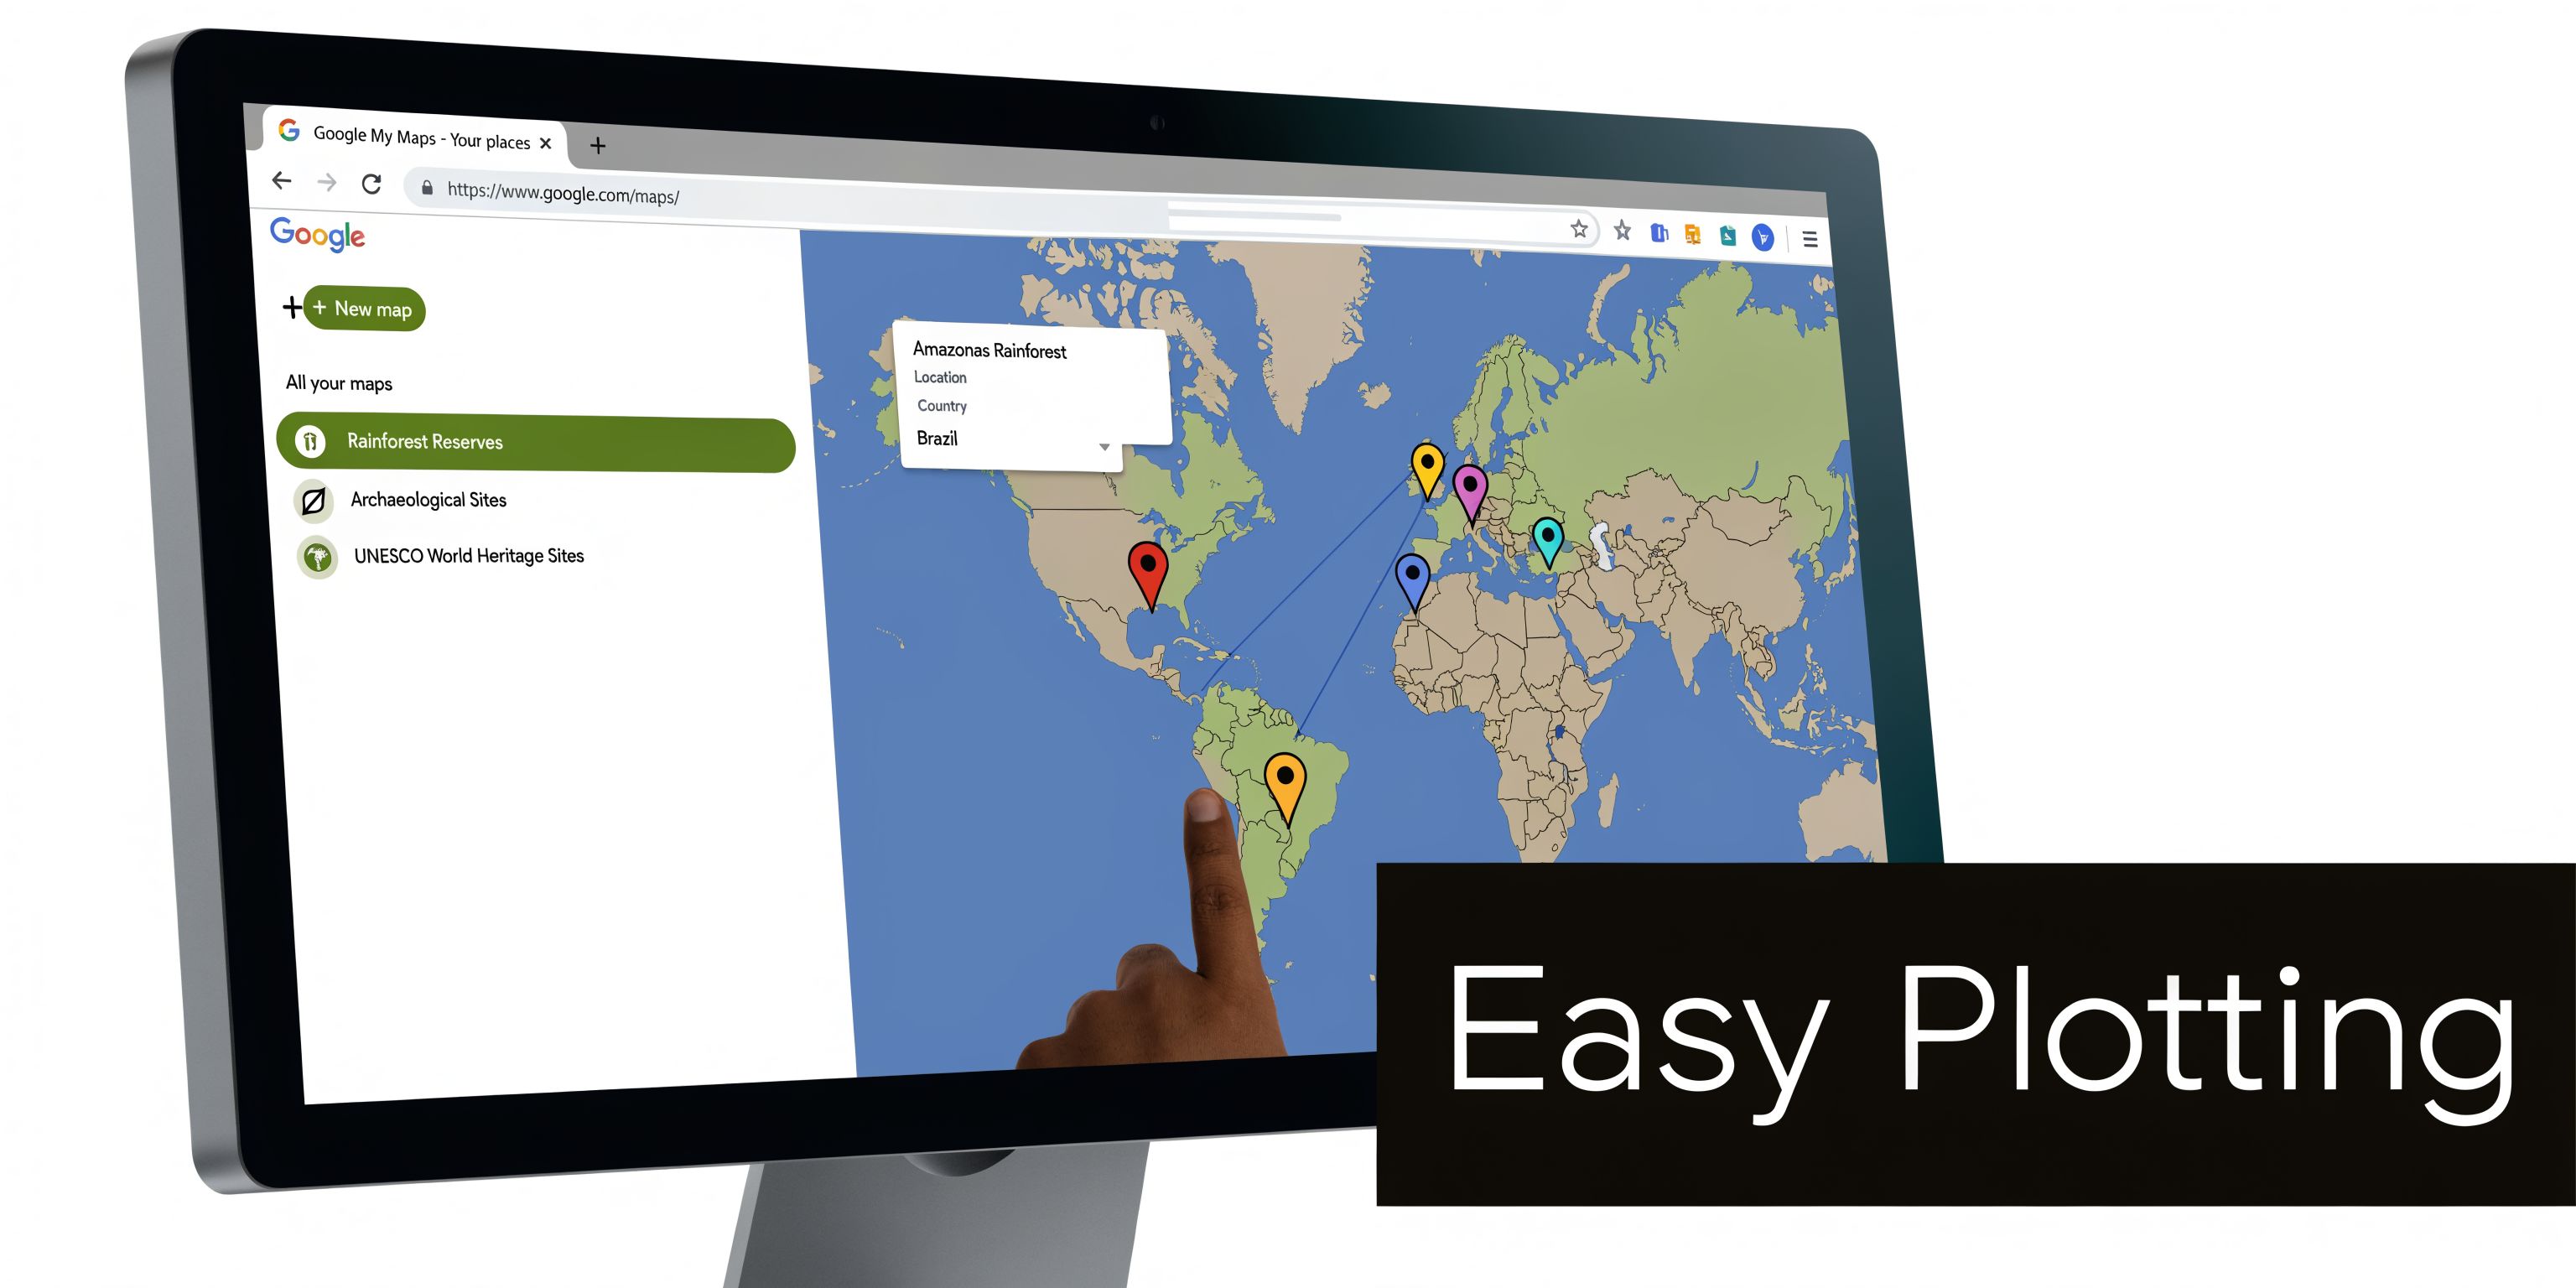
That is where Google My Maps fits. It turns a static address list into a usable map quickly, which makes it a strong choice for planning, presentations, territory reviews, and early MVP discovery. If the map is helping your team understand location data, My Maps is often enough. If the map will become part of the product experience inside Bubble, treat it as a fast prototype, not the final build.
How to prepare the file
Import quality depends on sheet quality.
Use a CSV or Google Sheet with at least these columns:
Name column: A clear label such as customer name, property name, or store name.
Address column: The full address in one field when possible.
Optional category field: Useful if you want different colors or icons by type.
Keep naming practical. A clear marker title matters for usability because people scan the map by label. If you use an internal record ID, the map is harder to read and less useful in meetings. If you use “Customer Name” or “Property Address,” someone can understand the map without needing your CRM open beside it.
If your data is split across street, city, state, and postal code, combine it before import unless you have a specific reason to keep fields separate.
How the import works
Create a new map in My Maps and import the sheet. Google asks two important questions. Which column contains the location data, and which column should be used as the marker title.
Get those choices right and the rest is straightforward.
My Maps supports up to 10 layers on one map, with up to 2,000 locations per layer, for a total of 20,000 points. That is plenty for many internal use cases, but the limit is not the main constraint in practice. Maintenance is. Once the source data changes often, manual updates become problematic.
Why My Maps works well
The strength here is speed and low setup overhead. You can:
Style markers quickly: Assign colors and icons by category.
Organize with layers: Separate leads, active customers, and partners.
Share the result easily: Keep it private or publish it for broader access.
Test the business need first: See whether users need filters, routing, or live updates before you build them in Bubble.
That last point matters. I often use My Maps as a decision tool. It helps founders confirm what the map needs to do before they spend time wiring database logic, privacy rules, and user-specific views inside an app.
A short walkthrough helps if this is your first import:
Where it starts to break
My Maps works best for a snapshot, not a living product feature.
Once addresses change frequently, the workflow gets fragile. Someone has to re-import data, fix bad matches, and keep shared links current. It also sits outside your Bubble app, which means the map cannot easily respond to logged-in users, account permissions, saved searches, subscription tiers, or live database changes.
Here is the practical trade-off:
Use My Maps when | Do not use My Maps when |
|---|---|
You need a map for internal use or a presentation | You need real-time updates from app data |
Your list changes occasionally | Users need custom filters tied to account data |
A shareable visual is enough | The map is central to your MVP experience |
My Maps is a smart first step because it clarifies the job before you build the feature. You learn what needs to appear on the map, how people will use it, and whether the next investment should be Sheets automation, the Google Maps API, or a live Bubble integration.
Automating Your Map with Google Sheets and Add-ons
The first pain point after My Maps is not scale. It is maintenance.
A founder imports addresses once, likes the result, then realizes the sheet changes every few days. New leads arrive. Old sites get removed. Sales reps fix typos. At that point, the map is only as useful as the process behind it.
Why Sheets becomes the control layer
Google Sheets works well as the operational source of truth because non-technical teams already know how to edit it. Instead of treating the spreadsheet as a one-time export, treat it as the system feeding your map.
Here, add-ons and geocoding helpers earn their keep. The core idea is simple. Turn addresses into latitude and longitude in the sheet, keep that data clean, then reuse it wherever needed.
That gives you a better workflow for:
Repeat imports: Cleaner data for My Maps or another tool.
Shared ownership: Ops, sales, and support can all update one source.
Future product work: Coordinates are ready when you move into API or Bubble.
The practical workflow
I would structure it like this:
Clean the address fields in one canonical sheet.
Use a geocoding add-on or workflow to generate coordinates.
Save those coordinates in dedicated columns.
Review failed or unclear results manually.
Use that sheet as the feed for your map or app.
The important part is not the add-on itself. Tools change. The pattern stays the same. You want one reliable table with title, address, latitude, longitude, and optional category data.
Why this middle ground is worth it
Manual import starts to feel tedious much earlier than people expect. Google My Maps supports importing large datasets, but users with lists exceeding even 50 addresses often find the manual import and update process tedious, which is reflected in Google My Maps documentation and common user feedback around import limits.
That is the primary reason to move to Sheets automation. Not because you need a fancy stack. Because repetitive admin work kills momentum.
A few practical habits help:
Keep one address format: Do not mix full addresses with partial entries.
Separate raw and cleaned data: Preserve imports, then normalize them in a working tab.
Flag uncertain rows: If a location looks wrong, do not let it pass unaddressed.
Store coordinates once: Reusing coordinates is cleaner than geocoding the same row repeatedly.
This method still has limits. It is not a full app architecture. But it creates the clean data foundation most no-code builds need. If you skip this discipline early, you usually pay for it later when the map starts showing wrong pins or duplicate locations.
Building a Custom Solution with the Google Maps API
Once the map stops being a document and starts becoming product functionality, prebuilt tools get restrictive. That is when the Google Maps API becomes the better mental model, even if you are building in no-code.
You do not need to become a developer to use it well. You do need to understand the moving parts.
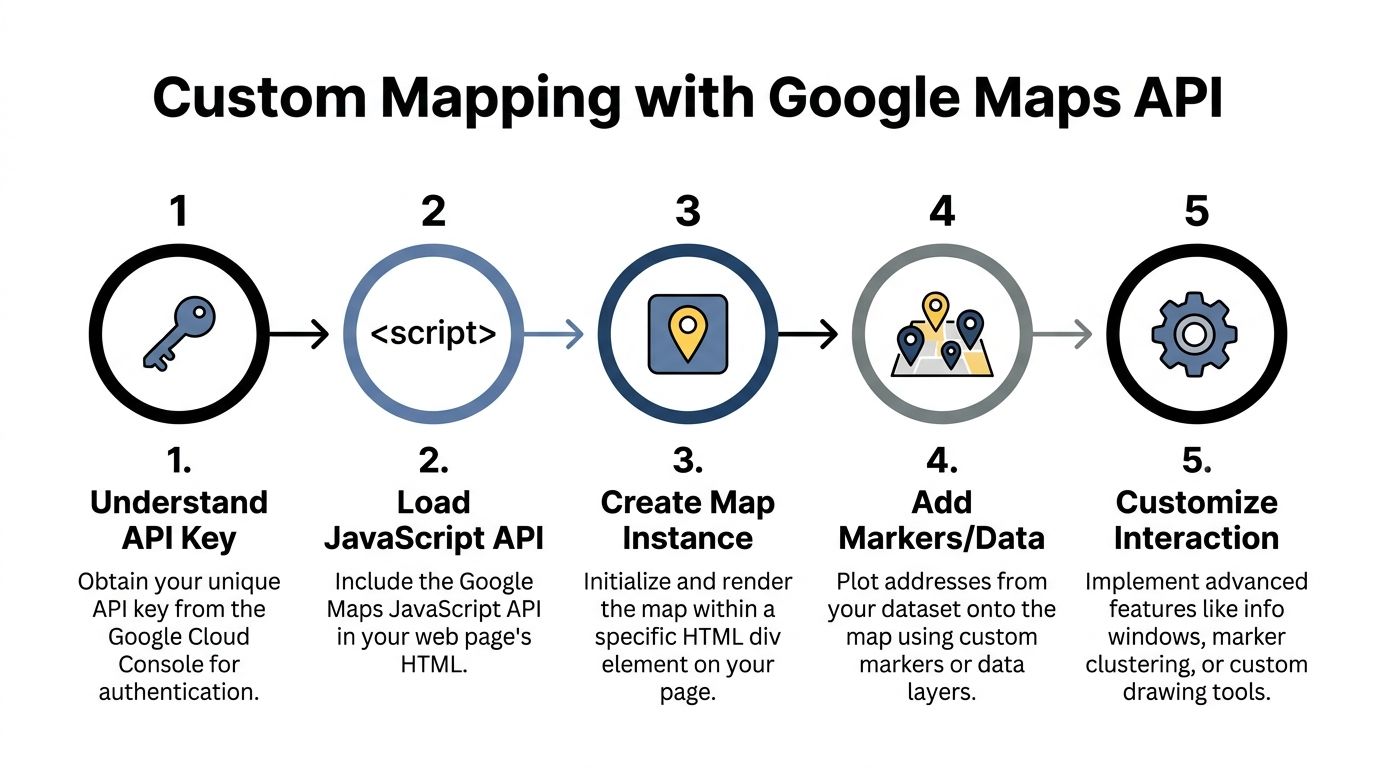
The three concepts that matter
For google maps plotting multiple addresses in a real app, most founders only need to grasp three building blocks.
Geocoding
Geocoding turns a street address into coordinates. This is the step that lets your app put a marker in the right place.
The mistake is assuming geocoding is always clean. It is not. Recent AI improvements have helped, but the edge cases still matter. Recent AI enhancements in Google’s geocoding have improved precision by over 20%, but error rates for ambiguous or international addresses can still exceed 15%, according to Google Earth Outreach guidance on visualizing data with custom maps.
That means you should build for validation, not blind trust. If your app accepts user-entered addresses, expect misspellings, abbreviations, duplicate cities, and partial postcodes.
Markers
Markers are the visible pins or custom location elements on the map. This sounds trivial until you need to decide what a marker represents.
A marker can represent:
a customer
a delivery stop
a property
a service zone
an event venue
a mobile worker’s current location
The key product decision is what users should learn from a marker click. If a marker only repeats the address, it is underpowered. In an MVP, the marker often needs to reveal the next action. View profile. Start route. Open booking. Check status.
Clustering
Clustering groups nearby markers so the map stays usable at higher density. Without it, the user sees a pile of overlapping pins and gives up.
Founders often ask for “all locations visible” and then hate the result when hundreds of markers fight for the same space. Clustering is not decoration. It is a usability feature and often a performance feature too.
What an API key does
An API key is the credential that lets your app talk to Google’s services. In practice, it is how Google knows the request is coming from your project.
For a non-technical founder, the important part is not the key itself. It is knowing that map loading, geocoding, and other services are distinct pieces. If someone says “the map works but geocoding fails,” that is believable because they are separate capabilities.
Why this matters inside no-code
Bubble builders benefit from understanding API structure because Bubble is not magic. It still depends on requests, responses, data storage, and UI rendering.
If you are evaluating whether to build this yourself or hire help, a grounding in no-code app development concepts makes these API conversations far easier. You can ask better questions about where addresses are stored, when geocoding happens, and how marker data should be filtered.
The product trade-offs that matter
Custom API work gives you control that spreadsheet tools cannot match:
You gain | Why it matters |
|---|---|
Dynamic marker lists | Show different locations by user, team, or status |
Better UX | Open custom popups, side panels, and filtered views |
Data ownership | Use your own database as the source of truth |
Extensibility | Add search, clustering, categories, and workflows later |
But you also take on more responsibility.
You now need to think about:
Address validation: Bad input produces bad pins.
Geocoding timing: Do you geocode on data entry or later in a background process?
Storage strategy: Save coordinates so you are not repeating unnecessary lookups.
Map behavior: Decide what happens when users zoom, filter, or click markers.
The API is not “better” because it is more technical. It is better when the map needs to respond to live business data and user actions.
For most MVPs, that is the line. If the map is part of the product logic, move to API thinking. If it is just a visual artifact, stay lighter.
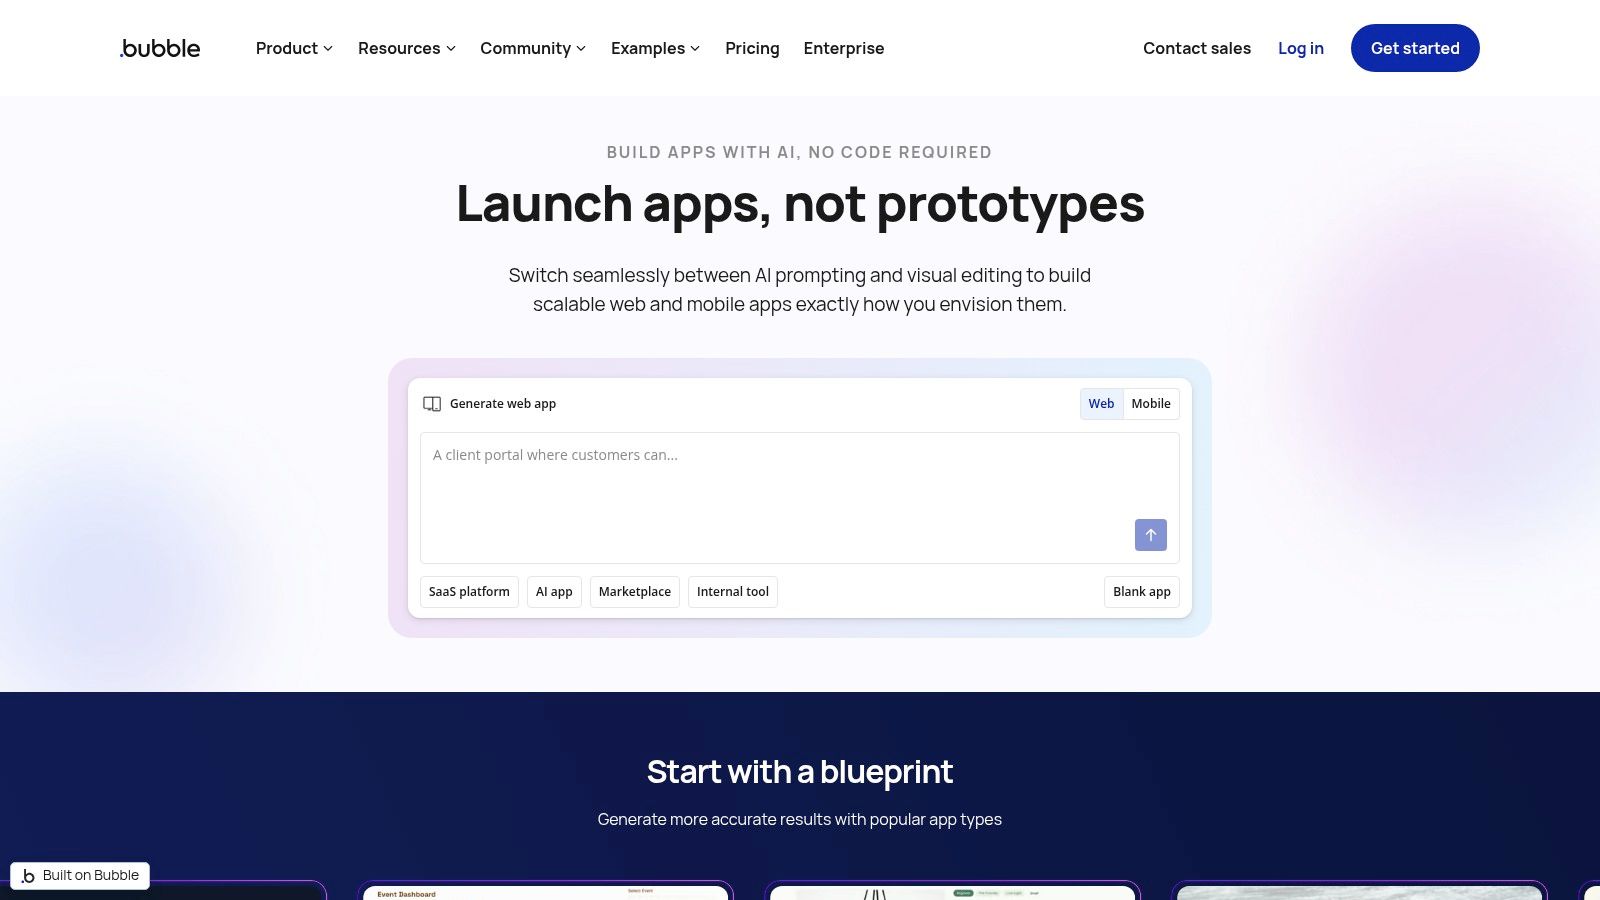
Integrating Live Maps in Your Bubble Application
At this point, the map stops being a separate tool and becomes part of your product.
In Bubble, the advantage is control. Your map can reflect your database, your user permissions, your filters, and your workflows. That is what turns google maps plotting multiple addresses into an actual app feature instead of a side document.
What the Bubble setup usually looks like
A solid Bubble approach is usually built from four parts:
Database fields: Store address text, latitude, longitude, status, and category.
Geocoding workflow: Use API Connector or a plugin to turn addresses into coordinates.
Map element: Display a dynamic list of markers from Bubble data.
Filter logic: Limit what appears based on current user, search, territory, or stage.
The biggest improvement comes from geocoding once and saving the result. Do not make the map resolve every address from scratch each time the page loads if you can avoid it.
Why Bubble is the right endpoint for many founders
If your app has users, roles, or ongoing activity, Bubble beats external mapping tools because the map can follow app logic.
Examples:
A marketplace can show only listings available in the user’s selected region.
A field service app can show open jobs for the logged-in technician.
A CRM can plot accounts by rep, stage, or renewal status.
A property tool can show only sites matching a selected investment profile.
That level of control is why many founders eventually move from shared maps to product-integrated maps. If you are already building your MVP on Bubble, it is worth understanding how a Bubble app builder approach changes the map from static output to live interface.
The routing warning founders miss
A lot of teams confuse “showing multiple stops on a map” with “route optimization.” They are not the same thing.
Google Maps’ native routing is limited to 10 stops and does not optimize for business logic like delivery windows, so for a logistics MVP in Bubble you need a dedicated routing API or custom logic, as explained by MyRouteOnline’s guide to mapping multiple locations on Google Maps.
That changes product scope in a big way. If your MVP needs only location display, Bubble plus map integration is enough. If users expect dispatch logic, route sequencing, or scheduling constraints, you need a routing layer too.
Common implementation choices
Here is the practical order I recommend:
Save the raw address in Bubble.
Trigger geocoding through API Connector.
Store latitude and longitude on the thing.
Render markers from a filtered search.
Add clustering or category styling if the map gets crowded.
That order keeps the build manageable. It also avoids the trap of trying to solve routing, live tracking, and territory management in version one.
The best Bubble map builds stay narrow at launch. Plot the right records, make filtering useful, and let users click into the next action. Fancy map behavior can wait.
Choosing Your Method and Best Practices
The right method depends on three questions. Is your data static or changing? How much control do you need? Is the map a document or part of the product?
A simple decision framework
Use this as the shortcut:
Choose Google My Maps if you need a fast visual map for a stable list.
Choose Google Sheets automation if the list changes and your team needs a repeatable workflow.
Choose the Google Maps API model if the map must behave like a product feature.
Choose Bubble integration if the map should respond to user data, app logic, and filters inside your MVP.
Best practices that apply in every setup
Some rules do not change, no matter which method you use:
Clean addresses before import: Fix formatting before blaming the tool.
Store coordinates when possible: Reuse them instead of repeatedly geocoding.
Design for density: If the map gets busy, clustering or category-based display becomes important.
Keep the map job-focused: Users should know what action to take after seeing a pin.
Scope routing separately: Displaying stops is one feature. Optimizing stops is another.
A lot of mapping frustration comes from using the wrong level of tool. Founders try to make My Maps act like an app, or they overbuild an API solution before validating the use case. Pick the method that matches the business need today, then step up only when the map becomes core product infrastructure.
If you are still comparing approaches, this broader guide to low-code vs no-code thinking helps frame when to stay simple and when to invest in more control.
If you want hands-on help choosing the right mapping setup, cleaning the data model, or wiring a live map into Bubble, Codeless Coach offers practical one-to-one guidance for founders and no-code builders who want to ship faster without weeks of trial and error.